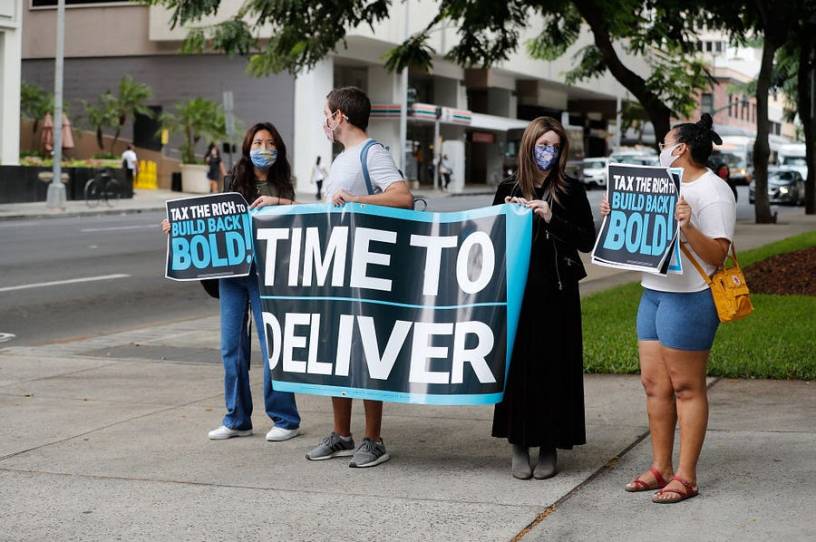
How Democrats Are Using the Pandemic to Advance Long-Term Spending Priorities
It is May 12, 2020. Sixty days have passed since President Trump declared a national emergency caused by the global spread of the novel coronavirus. In the interim, Congress has passed, and President Trump has signed into law, three major bills in response to the pandemic that will ultimately cost $2.5 trillion. Something like $1 trillion of that will be in the form of direct payments or subsidized benefits to American households. But in introducing the Heroes Act in the House of Representatives, Democrats are only at the beginning of a push to spend multiples of this amount—a push that continues almost a year and a half later.
We know now that poverty at the time was likely already lower than it had been a year earlier. But the $3.4-trillion bill—which passed the House three days later but died in the Senate—would have spent an additional $1.5 trillion on unemployment benefits, $1,200-per-person checks, health care subsidies, housing assistance, student loan forgiveness, food stamp (SNAP) benefits, earned income tax credits, and child tax credits. The faucet would not open fully until Democrats won control of both chambers of Congress and the presidency, eight months hence.
Progressives’ focus on propping up family finances may reflect admirable motives, but it has come with enormous costs. We should never be satisfied that poverty is “low enough,” but the pandemic has created other problems that we have not addressed as effectively and that demand attention now that poverty is again at an all-time low. With the reconciliation showdown looming, it is important to examine the consequences of progressives’ unprecedented campaign to direct government assistance to poor—and decidedly non-poor—Americans.
Before turning to that question, it is helpful to understand the behind-the-scenes push for a bigger safety net and how successful that campaign has been.
A Mistaken Narrative of Rising Hunger
The three early pandemic bills had scarcely become law before concerns surfaced about an unprecedented spike in hardship. Initial unemployment benefit claims had increased by a factor of 24 in the first month of the national emergency. When the Bureau of Labor Statistics released the April jobs numbers, they showed the largest one-month decline in employment going back to at least 1948. The bureau indicated that the unemployment rate, measured correctly, was about 19 percent—up from 4.4 percent in March, before the national emergency was declared.
How would the safety net hold up? The first indication came on April 30, when the Data Foundation released the first estimates on food hardship from its new COVID Impact Survey, fielded only days earlier. Fully 28 percent of households had worried over the previous 30 days that their food would run out. Was that number—or food hardship generally—elevated from the state of affairs before the pandemic? Answers—though inaccurate—would soon come. In a pattern repeated throughout the rest of the year, researchers took food hardship estimates from the rapidly fielded emergency surveys launched in response to COVID and compared them with much lower pre-pandemic estimates from more established surveys. As a number of other researchers warned throughout the year, technical methodological differences between the established surveys and the less carefully conducted COVID surveys created artificial jumps in food hardship that less critical researchers took literally.
On May 7, economists Phillip Levine of Wellesley College and Diane Schanzenbach of Northwestern University compared estimates from the COVID Impact Survey and a December 2018 “Food Security Supplement” to the federal Current Population Survey. They argued that food insufficiency had roughly doubled:
Economic distress is mounting as a result of the coronavirus crisis and it is critical to find ways to provide support for those most in need. For the past several decades, our safety net has primarily been aimed at promoting and rewarding work and has provided relatively little assistance for low-income families that are not employed. This means that some of the key programs in the social safety net are not structured to provide poverty relief during times when unemployment is rising rapidly and increasing hardship for families.
A blog post by Lauren Bauer at the Brookings Institution’s Hamilton Project around the same time used the same surveys as well as an estimate from a one-time “Survey of Mothers with Young Children” to report similarly large increases. Her conclusion: “Food security programs … must be strengthened and expanded immediately.”
Marianne Bitler, Hilary Hoynes, and Schanzenbach presented a study in June that compared the 2018 Food Security Supplement estimates to numbers from a new Census Bureau survey, the Household Pulse Survey (HPS). They, too, reported large jumps in hardship. They also reported that in the 2018 National Health Interview Survey, 11 percent of respondents said the food they bought “just didn’t last,” while the COVID Impact Survey found that rate to be 23 percent in April 2020. The report argued for further expansions to unemployment and SNAP benefits and criticized the safety net as overly focused on work.
A July Hamilton Project report including Bauer and Schanzenbach as authors compared estimates from the Food Security Supplement to the HPS figures. The authors claimed that food insecurity among adults with children ages 5 to 17 doubled between 2018 and mid-2020, rising from 15 percent to 30 percent. An October study by James Ziliak in Applied Economic Perspectives and Policy compared the Food Security Supplement numbers to the HPS and concluded that food insufficiency rates among all adults had tripled since 2019.
And in November, another Bauer blog post, entitled, “Hungry at Thanksgiving” compared the same two surveys. Bauer asserted that very low food security among children had risen from below 5 percent in 2018 to nearly 20 percent by mid-2020. She called for a 15 percent increase in SNAP benefits.
Journalists advanced these claims of spiking hardship. Bauer’s early May estimates were featured in a New York Times article by Jason DeParle (“As Hunger Swells, Food Stamps Become a Partisan Flashpoint”). In November, the Washington Post published a long piece credited to four authors—an “all-hands-on-deck package about the terrifying state of hunger in America”—with multiple photographic portraits, data graphics, and striking drone footage of Houston cars lined up for free Thanksgiving meals. Referring to food security estimates, the piece warned that, “Experts say it is likely that there’s more hunger in the United States today than at any point since 1998, when the Census Bureau began collecting comparable data about households’ ability to get enough food.” The next month, a Post article about rising shoplifting cited the earlier one, saying that, “Hunger is chronic, at levels not seen in decades.”
And policymakers responded. Apparently citing Bauer’s early blog post, Speaker Nancy Pelosi’s May “Dear Colleague” letter to House members endorsing the Heroes Act began, “The Heroes Act addresses hunger in America. … Surveys show that 1 in 5 mothers of children under 12 say that their children are not getting enough food during the coronavirus crisis – three times the rate during the depths of the Great Recession.” The House Appropriations Committee cited “rising hunger” in a September press release trumpeting a revised Heroes Act.
There was just one problem: Due to differences in the way rapidly fielded COVID surveys were designed, the 2020 estimates of food hardship were not comparable to the estimates from the pre-pandemic surveys. This discrepancy was first noted, by me, on May 27, 2020. The Household Pulse Survey indicated that many people did not have enough to eat in early May. But responses to an HPS question asking about hardship “before March 13” (prior to the coronavirus national emergency) suggested that nearly as many lacked enough to eat pre-pandemic. Even the “before March 13” rates were too high relative to Food Security Supplement rates from prior years. My colleague, Angela Rachidi demonstrated the same point in August.
At the June conference where Bitler, Hoynes, and Schanzenbach presented their paper, their discussant was uneasy with the comparison of estimates from surveys fielded before and after the start of the pandemic. Another paper presented there, by Jeehoon Han, Bruce Meyer, and James Sullivan, echoed the concern. It reported monthly poverty estimates showing a decline in hardship through June 2020 (though those estimates looked back at income earned over the previous year rather than in the past month).
Also in June, a team from the Columbia University Center on Poverty and Social Policy released poverty estimates for early 2020. It found the rate was 12.5 percent in February but somewhere between 11.3 and 13.8 percent in April—again a far cry from the dramatic spikes reported by food hardship researchers. In mid-October, the Columbia researchers introduced a longer updated monthly poverty series, revealing that poverty fell between February and April. Under the assumption that federal policymakers did nothing more the rest of the year, the researchers projected the poverty rate would be less than one point higher in December than at the end of 2019. For comparison, their estimates showed monthly poverty rising by about 3.5 points during the Great Recession.
In a July report, the University of Michigan’s poverty center warned that “while it would be ideal,” to compare the post-lockdown and pre-COVID food hardship rates, “there are many differences in data sources measuring food insecurity related to survey questions and administration, making such comparisons difficult.” The report noted evidence that nonpayment of rent and eviction filings were both “close to pre-pandemic figures.”
At the end of July, the Bureau of Economic Analysis released second-quarter economic growth figures. The numbers revealed an historic spike in the personal savings rate—hardly what would be expected if financial distress had grown more common. That rate exceeded 10 percent in a single month between 1993 and early 2020 (in December 2012, in response to tax incentives). In March 2020, it rose to 13 percent, and then it increased to 34 percent in April. It would not fall below 10 percent for the next year.
One week after the Columbia team released its updated monthly poverty series, Rachidi and I published a report that demonstrated that erroneous conclusions about food hardship spikes were easy to draw even before the pandemic if estimates from incomparable surveys were connected. The kinds of increases in food hardship researchers were claiming were far larger than in the Great Recession, and poverty and food hardship tracked each other well then. We surmised that food hardship had become only modestly more common.
With the new food hardship and poverty figures for 2020, released earlier this month, we know that hardship over the course of 2020 increased little, if at all. The safety net—supposedly too focused on encouraging work to keep families afloat—succeeded remarkably at staving off financial calamity. But policymakers were not done yet.
Settling for $900 Billion
Largely because of opposition by Senate Republicans, the additional policy response to the pandemic after April would be modest until the very end of the year. Neither party responded to the public health emergency effectively, nor the increasingly apparent damage to children and young adults from distance learning. But Republicans were prudent to oppose Democratic efforts to continue flooding Americans with federal benefits.
The Heroes Act was dead on arrival in the Senate. Republicans favored a smaller bill, the HEALS Act, though at $1.1 trillion, it was hardly miserly. Payments to families, at around $420 billion, were lower by more than $1 trillion than in the Heroes Act. But the HEALS Act lacked sufficient support among Republicans to pass. In August, President Trump tapped a disaster relief fund created by the CARES Act to extend the expiring unemployment bonuses that law created. States used the funding to provide several additional weeks of bonuses during the fall (reduced from $600 to $300).
House Democrats eventually offered a less ambitious version of the Heroes Act, which they passed at the start of October. Heroes 2.0 was whittled down to a mere $2.4 trillion, including nearly $1 trillion in benefits and payments to individuals. Its proponents would have to settle for the $913-billion Coronavirus Response and Relief Supplemental Appropriations Act, signed into law by President Trump on December 27. The CRRSAA spent $330 billion on stimulus checks, unemployment benefits, housing assistance, SNAP, and the earned income tax credit. Thus did 2020 end with COVID spending topping $3.4 trillion and payments to individuals exceeding $1.3 trillion.
The CRRSAA was only a taste of what was to come in 2021, but it was already excessive. The Columbia estimates earlier in the year had already indicated that poverty in December would be only modestly higher than a year earlier without it. Before the law passed Congress, the Columbia research team projected that poverty would be lower in January 2021 than in January 2020 if expiring unemployment provisions were extended (as they were). Those projections did not include the impact of the second round of stimulus payments that CRRSAA also enacted.
Subsequent data has confirmed that the spring response to the pandemic kept poverty at 2019’s all-time low level. The food security estimates released this fall—from a survey fielded before CRRSAA passed—showed 2020 hardship was no higher than in 2019. The latest federal “Supplemental Poverty Measure” estimates also show poverty falling in 2020. While those estimates count the December stimulus payments in income, poverty would have declined even without them. Moreover, comparing administrative totals to survey responses indicates that a larger-than-normal share of unemployment benefits went unreported in 2020.
Turning the Firehose Back On after the Fire Is Out
When President Biden took office in January 2021 with Democratic control of the House and Senate, the immediate priority was passing the American Rescue Plan Act (ARPA). This law would become the vehicle for a number of priorities that were orphaned in the Heroes Act. ARPA was signed into law March 11, 2021, adding another $1.8 trillion to the national debt. From that amount, $850 billion came in the form of an expanded child tax credit, another extension of more generous unemployment benefits, yet another round of stimulus checks, and a variety of other payments and benefits to individuals.
After March, Democrats might have focused on immediate ways to contain the spread of the coronavirus and COVID-19 infection; remediating the learning losses that kids experienced in 2020 and 2021; getting employment back up to encourage economic growth; withdrawing from Afghanistan effectively and responsibly; or beginning the difficult task of bringing the national debt down to a manageable level. Instead, they have shifted to the party’s longer-term goals, marketed under the slogan, “Build Back Better.” (Indeed, this shift was already underway; the expansions to the child tax credit included in the Heroes Act and passed in ARPA were first proposed by Rep. Rosa DeLauro and Sen. Michael Bennet in 2017.)
Biden followed up the American Rescue Plan with proposals for an American Jobs Plan and an American Families Plan. The gross costs of the latter two came to $4.45 trillion, though unlike the 2020 bills, the spending was offset by sizable tax increases on corporations and upper-income households and better tax enforcement. Still, over 10 years, the net cost was projected to be $1.2 trillion.
The American Jobs Plan was ostensibly an infrastructure package but included $400 billion for expanded long-term care benefits through Medicaid and $100 billion toward workforce development (in addition to $273 billion to build and repair housing, schools, and child care facilities). All of that and more was dropped from the bipartisan Infrastructure Investment and Jobs Act that passed the Senate in August and now lingers in the House pending a vote. That bill would add $398 billion to the deficit.
As for the American Families Plan, much of it will be incorporated into the 2022 budget reconciliation bill that has fractured the Democratic caucus . The AFP included more than $1 trillion in payments and benefits to individuals—extensions to the expanded child tax credit and earned income tax credit, health care premium subsidies, Pell grant expansions, more generous child and dependent care tax credits, and food benefits. Another $348 billion would have provided free pre-K, community college tuition, and tuition at institutions that historically serve minorities. There would also have been $225 billion each for paid leave and child care.
The reconciliation bill adds a wide range of health care benefits not contemplated in the American Families Plan, and includes spending toward climate change. Initially, it was expected to cost $3.5 trillion, or perhaps $600 billion after offsets. This cost is understated in that some provisions are extended only for a few years before ostensibly expiring (spoiler alert: they often don’t). As of this writing, it looks like Democratic moderates will succeed at shrinking the bill to a bare $2 trillion, partially offset.
Even if the reconciliation bill costs $600 billion on net, and both it and the infrastructure bill become law, we are looking at another $1 trillion added to the national debt. An August increase in the generosity of SNAP benefits by the Biden administration will likely add another $180 billion. On top of the ARP’s cost, the total for 2021 would be $3 trillion, nearly as much as the $3.4 trillion from 2020. The two-year total of $6.4 trillion would include maybe $2 trillion in payments and benefits to individuals.
For context, accumulated deficits over the eight fiscal years from 2012 to 2019 were $5.7 trillion. During the worst four fiscal years of the Great Recession, deficits totaled $5.1 trillion. If you give President George W. Bush the deficits from the eight fiscal years 2002 through 2009, his tax cuts, the Afghanistan and Iraq wars, and the initial response to the Great Recession and financial crisis (plus everything else) come to $3.5 trillion.
Not Letting a Crisis Go to Waste
The Columbia researchers estimate the poverty rate in August 2019 was 16.6 percent. The same month in 2020, it was slightly higher at 17.3. This past August it was 12.0 percent. No doubt there is much to be said for fewer children, parents, and senior citizens in our families and communities being poor. But if the imperative—or one imperative—of policymaking during our plague years has been to avoid the misery that might result from a depression or a temporary but epidemiologically necessary partial shutdown of the economy, anti-poverty policy clearly has gone further than was necessary.
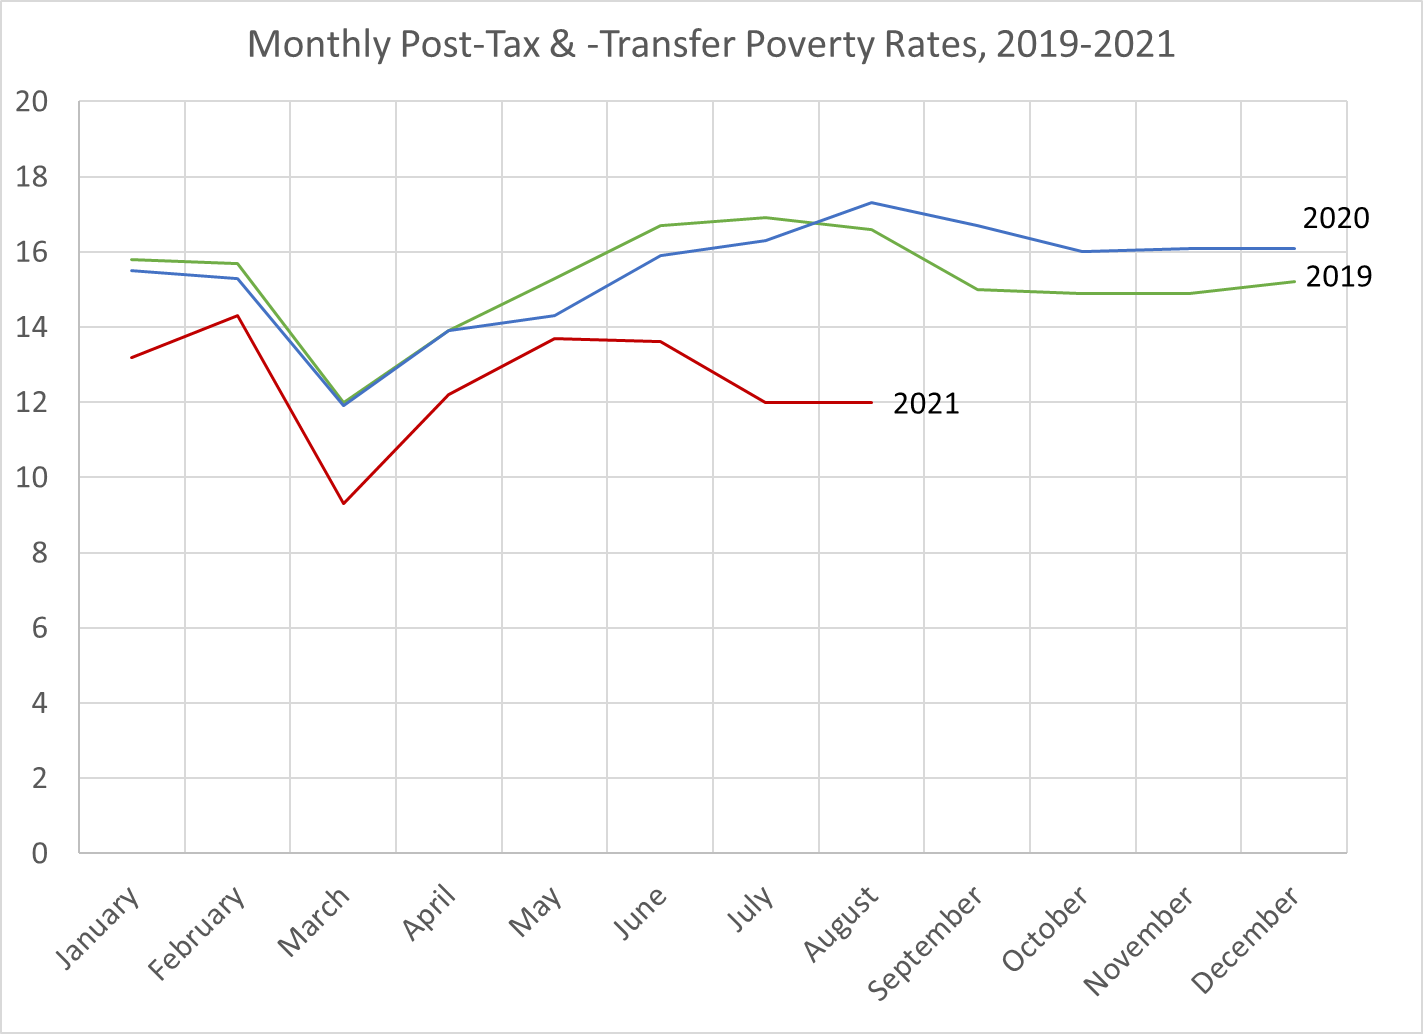
Source: Author’s analysis of data from the Columbia University Center on Poverty and Social Policy
More to the point, progressives’ unyielding prioritization of spending to reduce poverty has come with short-term consequences in the form of problems that have not received enough attention. Their post-pandemic vision of anti-poverty policy runs the risk of substantial long-term costs from deficits and counterproductive responses to more generous aid. There will be more to say on these points.
Claims of elevated hardship have become rarer in 2021. In no small measure, that has been due to a shift in the narrative that has pointed to the now-clear poverty-reduction effects of previous rounds of legislation to justify subsequent rounds. The success of ARPA’s temporarily expanded child tax credit, for instance, in lowering child poverty is cited to champion the extension called for in AFP and that is likely to be included in the reconciliation bill.
But advocates of greater spending still traffic in bad stats from time to time to make their argument. Just in the last month, Speaker Pelosi returned to her earlier claim about food hardship to advocate for extending the temporary child tax credit expansion, saying that “1 in 5 children in America goes to sleep hungry.” The claim—like her earlier one plumping for the Heroes Act—was a rendering of figures from that early Hamilton Project blog post.
The analyses there indicated that 17 percent of mothers with children under 12 in an April 2020 survey said that “since the coronavirus pandemic” “the children in my household were not eating enough because we just couldn’t afford enough food.” That was up, supposedly, from 3 percent in the incomparable December 2018 Food Security Supplement. When I looked at the corresponding figure in the newly-released December 2020 Supplement data, it was 3 percent.
Those Supplement figures referred to insufficient food at some point over the previous 12 months. Just 2 percent of the mothers experienced this problem over the previous 30 days in December 2020 (same as in December 2019). One in 5, 1 in 50—it’s all the same when you’re single-mindedly trying to transform the American safety net.
Rahm Emmanuel, former chief of staff to President Obama and mayor of Chicago, famously said of the Great Recession, “You never want a serious crisis to go to waste … This crisis provides the opportunity for us to do things that you could not do before.” It is a message that progressives have taken to heart during the pandemic, but not to their credit.
Please check out the first piece in Scott Winship’s series on poverty and the pandemic: “How We Kept Poverty Down in 2020.”