
Last week, for the second week in a row, new federal statistics revealed that hardship in America was at or near an all-time low in 2020—a year that saw a once-in-a-century pandemic upend economic and social life. Census Bureau figures on food insecurity and poverty agreed that hardship was contained successfully last year. This fact is cause for celebration and a testament to the extraordinary efforts by policymakers early on in the pandemic.
However, after the initial flurry of legislation, Federal Reserve Board actions, and administrative efforts, Democratic policymakers continued a counterproductive focus on poverty rather than pivoting to other pressing priorities. This single-mindedness increased substantially after Joe Biden became president, and the current battle over budget reconciliation is only the latest manifestation.
Reducing poverty is always an important objective, but poverty today is lower than in 2019, when it already was lower than ever before. Democrats spent much of 2020 worrying over demonstrably dubious claims about soaring hardship. Republicans, to some extent, bought into the view that newly expansive government transfers were an imperative even after the March and April legislation—President Donald Trump and Treasury Secretary Steven Mnuchin in particular.
Irrecoverable time, energy, and funds were lost in 2020 that could have gone toward keeping the coronavirus from becoming endemic and preventing ruinous learning losses among children subject to remote schooling. Now, in 2021, the Democrats have used the lingering pandemic and their unified control of the White House and Congress to continue their misplaced emphasis on poverty reduction and ramp up the focus on safety net benefits. Meanwhile, the national debt is rapidly approaching an all-time high as a share of the economy. And we are barreling away from a safety net policy that has succeeded by combining generosity with expectations of personal responsibility. Hardship may be at a historic low, but intergenerational mobility from the lower rungs of the income ladder has not budged since Lyndon Johnson declared war on poverty. Reducing child poverty turns out not to afford greater access to a middle class adulthood.
Remediating against learning losses, promoting upward mobility, and returning the economy to its normal state—while reckoning with our long-term fiscal imbalance—will not be easy. But it will be impossible if we do not reject progressive attempts to exploit the public health crisis to transform policy permanently. As a first step, we must recognize the progress we have made reducing hardship and the risks and lost opportunities entailed by a headlong rush to transfer as much government assistance as possible to low-income and middle-class families.
In forthcoming pieces, I will explore advocates’ and policymakers’ failure to shift priorities and the potential costs of this failure. But first, let us consider the striking policy success story of poverty in 2020.
Hardship Was Contained in 2020—or Reduced
Every September, the U.S. Department of Agriculture releases estimates of the food hardship experienced in the previous calendar year. It takes that much time to process the data from when the Census Bureau administers the survey the previous December. The estimates come from the “Food Security Supplement,” which is tacked onto the Current Population Survey (CPS) in the last month of every year.
The headline finding from this year’s release was that food hardship was largely unchanged between 2019 and 2020 despite the pandemic. For instance, 10.5 percent of households were deemed “food insecure” in both years, based on their answers to an array of questions. The Food Security Supplement asks whether households sometimes did not have enough food over the previous 12 months. In 2019, 3.7 percent of households said that was sometimes or often true; in 2020, 3.5 percent did.
A larger share of households say that at some point in the preceding year they had “run short of money and [tried] to make [their] food or food money go further.” But while having to stretch food supplies and budgets is more common than not having enough food, my analyses indicate that it became rarer in 2020—falling from 19 percent of households in 2019 to 18 percent.
Some food hardship measures may have risen modestly; households with children apparently experienced somewhat more food insecurity in 2020 than in 2019 (14.8 percent versus 13.6). But the changes generally were small, and interpreting them is complicated by the fact that the survey selectively stops asking questions of people who do not indicate experiencing hardship on earlier questions. The “ran short of money” question is asked of everyone. In 2020, according to my analyses, this problem became rarer among households with children—and rarer among female-headed households with children—compared with 2019.
September is also the month in which new poverty estimates are released from the Census Bureau. Like the food hardship estimates, the poverty figures are based on a supplement to the population survey (conducted between February and April). Households are specifically asked about the preceding calendar year, so the September-released estimates are for that earlier year.
Interpreting the just-released figures for 2020 is complicated by the pandemic, but examined carefully, they actually tell a straightforward story. Because the federal government has an official poverty measure (OPM) that is used in federal policymaking, it tends to garner all the attention. According to that measure, poverty rose in 2020—from 10.5 percent in 2019 to 11.4 percent in 2020.
However, the real story is that poverty fell to an unprecedented low in 2020, despite the public health crisis. The OPM suffers from a number of well-known shortcomings, and in a more rational world, the official measure would have been improved long ago. Poverty researchers, recognizing the flaws of the official measure, generally focus on other variants. In particular, the Census Bureau has published a “Supplemental Poverty Measure” (SPM) for more than a decade. The SPM has its own flaws, but one unambiguous strength is that it uses an income definition that better captures the resources that people have in assessing whether they are in poverty. In particular, it includes non-cash benefits (like food stamps) and accounts for taxes and refundable tax credits (such as the earned income tax credit). In 2020, the OPM did not count as income the money received from the two rounds of economic impact payments, also known as “stimulus checks,” but the SPM did.
Last year, the poverty rate according to the SPM fell from 11.8 percent to 9.1 percent. Poverty was rarer in 2020 than in any previous year since the Census Bureau began estimating the SPM in 2009. Poverty fell among children, nonelderly adults, elderly adults, married couples, single men, single women, homeowners, renters, non-workers, workers, non-Hispanic whites, blacks, Asians, and Hispanics. It fell in all regions of the country, across all education groups, and in rural and urban areas.
Other data sources confirm that hardship decreased in 2020. In April of this year, an Urban Institute report discussed results from the Well-Being and Basic Needs Survey, conducted in December 2019 and again the same month in 2020. Not only was food insecurity down, but so were utility shutoffs and problems paying medical bills. Google searches for “payday loan” fell over the course of the year, suggesting that high-interest lending to consumers unable otherwise to meet their daily needs grew rarer. Data on on-time rent payments to landlords for May through July suggested only modestly lower rates than in the same months in 2019. Evictions were down from 2019 in almost every week of 2020 after the public health emergency started, even in cities and counties with no eviction ban in effect.
Monthly Poverty Data Reveal the Importance of the Initial Policy Response to the Pandemic
To understand what happened last year, we have the benefit of monthly poverty estimates. Until the pandemic, there was little need for monthly poverty rate data, and therefore little attention given to the data that was available. Even that earlier data was available only with a substantial lag. To fill the gap, researchers at Columbia University’s Center on Poverty and Social Policy developed a way to model poverty rates using data from the monthly CPS (the source of the official unemployment statistics). As shown in the blue line in Figure 1, they found that poverty fell in March 2020, from 15 percent to 12 percent, before rising through August (to 17 percent). By December, the poverty rate was 16 percent, slightly above the 15 percent from December 2019.
Figure 1. Monthly Post-Tax & -Transfer Poverty Rates, 2019 and 2020
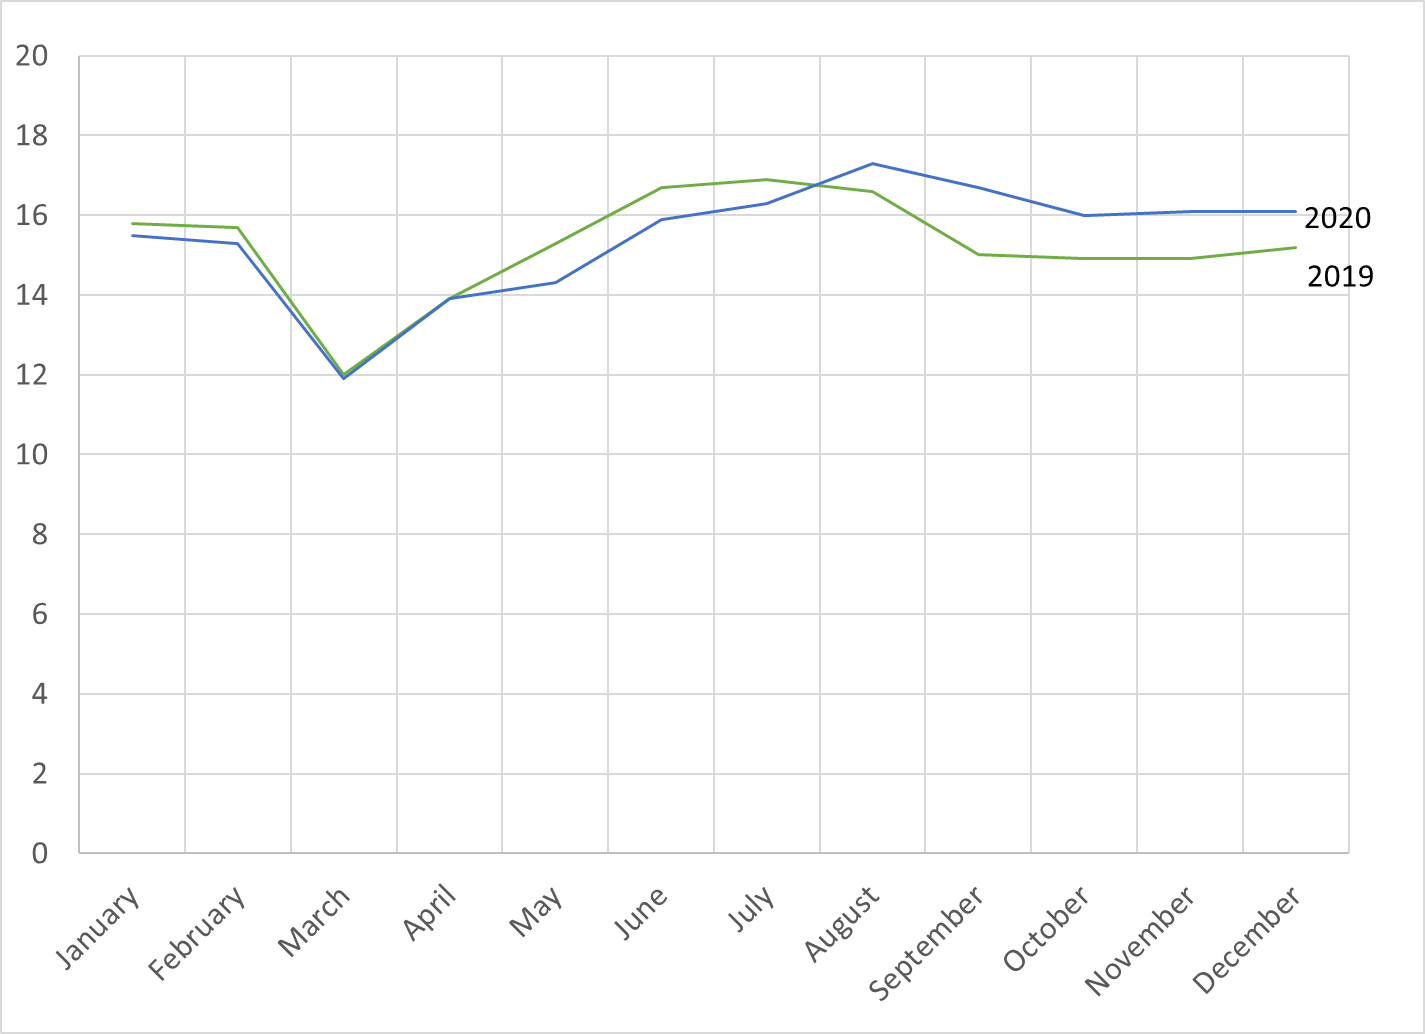
Source: Author’s analysis of data from the Columbia University Center on Poverty and Social Policy.
However, interpreting this trend is trickier than it may seem. Even in a normal year, poverty falls in March (and remains dampened in April) because many low-income households receive tax benefits in the form of the earned income tax credit. It is higher in June, July, and August because school nutrition benefits (breakfasts and lunches) and educational assistance to college students go away.
Comparing the 2020 trend to the trend for 2019 provides a clearer way of assessing how the pandemic affected poverty. The green line in Figure 1 shows the Columbia team’s 2019 trend. Until May, the 2019 and 2020 estimates were nearly identical. From May through July 2020, poverty was lower than in the same months one year earlier. In August, poverty rose above the 2019 level for the first time, and it remained elevated the rest of the year. But in late 2020, poverty was only about 1 point higher than in late 2019—an impressive achievement given the unprecedented nature of the pandemic in modern times.
How much did policy make a difference? Federal policymakers enacted a flurry of legislation in March and April 2020. The Families First Coronavirus Response Act (signed March 18), the Coronavirus Aid, Relief, and Economic Security (CARES) Act (March 27), and the Paycheck Protection Program and Health Care Enhancement Act (April 24) added more than $3 trillion to the national debt over 10 years. These laws delivered nearly $750 billion to households in the form of direct checks to families, unemployment benefits, and food benefits from the Supplemental Nutrition Assistance Program (SNAP) and Pandemic Electronic Benefits Transfer program.
The Columbia team publishes poverty trends before taking transfers and taxes into account, and as displayed in Figure 2, the 2020 trend shows a dramatic rise in poverty in April and May. Poverty rose by 8 points in April alone, meaning that the safety net had to work much harder to pull the post-tax and -transfer poverty rate down to the normal April level shown in Figure 1. Much of the American safety net ramps up automatically when the economy turns south. People can access unemployment benefits and means-tested programs like SNAP. But other Columbia estimates (not shown) indicate that without the CARES Act, the poverty rate in April would have been 19 percent—5 points higher than a year earlier. These estimates probably understate the importance of the CARES Act, because expanded food benefits appear to be counted in the non-CARES safety net by the Columbia team.
Figure 2. Monthly Pre-Tax & -Transfer Poverty Rates, 2019 and 2020
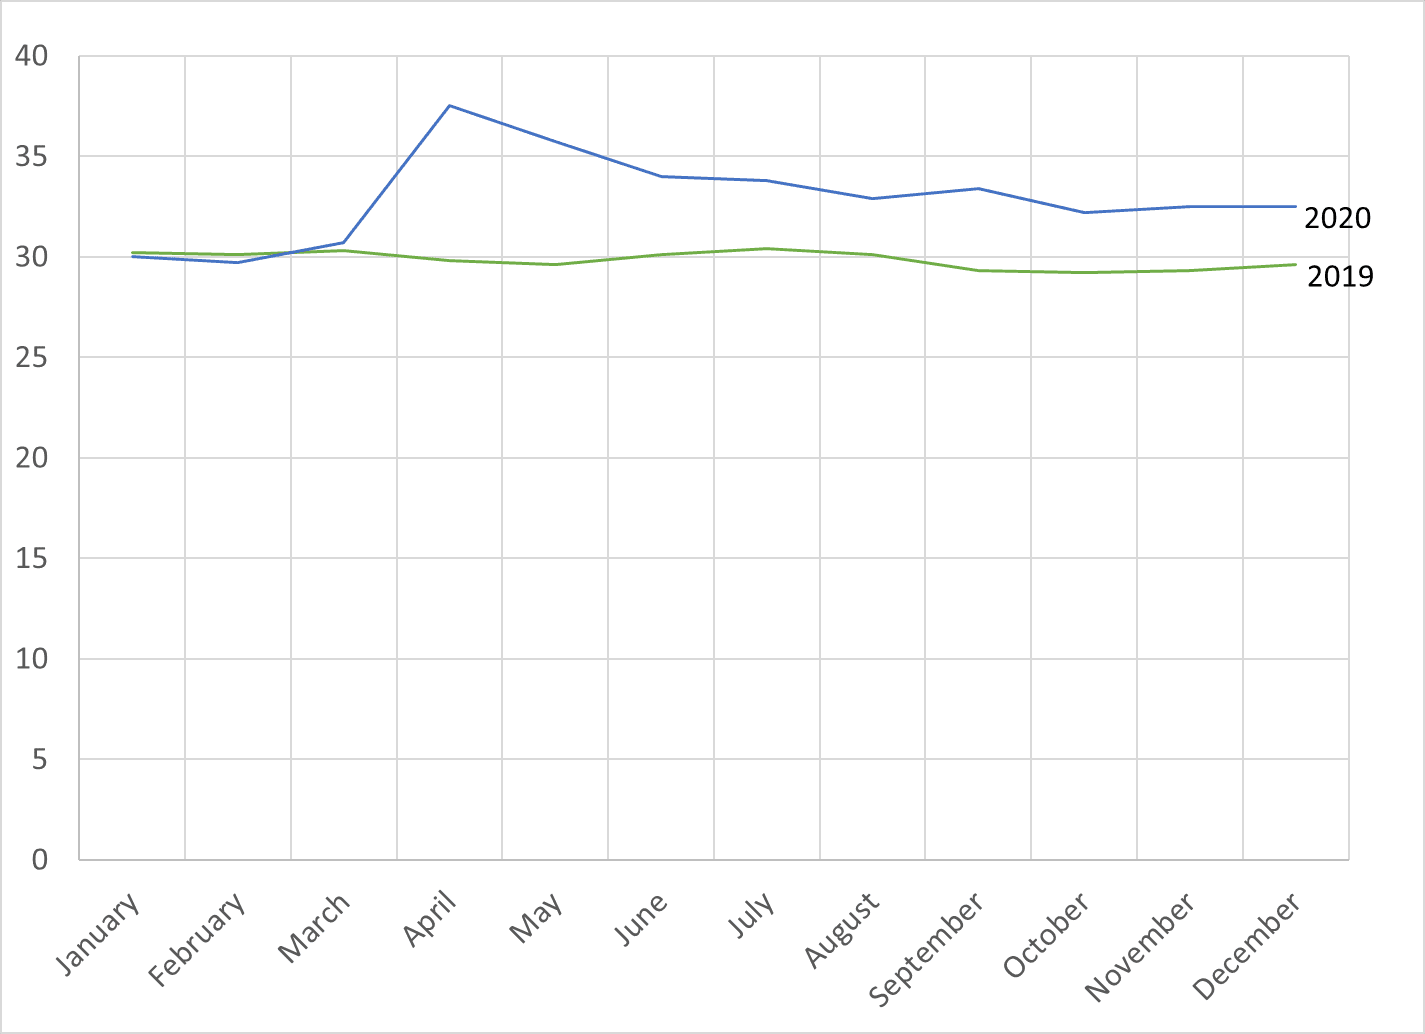
Source: Author’s analysis of data from the Columbia University Center on Poverty and Social Policy.
The higher poverty rates shown in Figure 1 from August to December reflect the expiration of the federal $600 top-off to weekly unemployment benefits. But the expanded safety net from earlier in the year—plus an additional top-off to unemployment benefits created by an August Trump executive order—continued to keep poverty lower than it would have been. At the end of the year, the poverty rate before transfers and taxes was 3 points higher than at the end of 2019. The safety net reduced that increase by two-thirds.
Conclusion
Even these figures understate the importance of all the policy efforts taken in spring of 2020 to prop up an economy that looked dangerously on the verge of collapse. Poverty would have looked far worse had the economy collapsed and unemployment rates exceeded 20 percent—even with an expanded safety net. Emergency assistance to businesses, state and local governments, schools, and health care organizations all helped keep the economy afloat. In addition, the Federal Reserve Board carried out an array of policies that provided loans and credit to businesses and maintained liquidity in the financial system.
Many policies enacted and implemented in spring of 2020 were flawed. A large share of the economic impact payments were badly targeted to households that did not need them. The unemployment benefit expansions were rife with fraud and abuse, as my intrepid AEI colleague Matt Weidinger has shown. In many cases, the assistance provided was so large relative to potential earnings that it proved a disincentive to re-employment. That potentially slowed the recovery (though the public health crisis might have put limits on employment growth at any rate). In a normal context—or with time for considered deliberation—many of these initial policies would have been tossed aside before reaching a vote or never considered in the first place. Indeed, some, such as the Centers for Disease Control and Prevention’s eviction ban, were never put to a vote. But it is remarkable how quickly policymakers acted to prevent a deep depression, and they should be commended for the effective economic policy response to the pandemic.
The public health and education policy responses, on the other hand, were in important respects great failures, as the economic policy response has been since mid- to late 2020. These failures were, in part, due to the insistence of a group of influential researchers that hardship had spiked with the onset of the pandemic and then remained alarmingly elevated. These claims were criticized throughout the post-CARES phase of the pandemic, and with the release of the new poverty and food hardship numbers, they have been proven wrong. But then and now, the failure to recognize the policy success of spring 2020 and to pivot to other important policy priorities has led policymakers to neglect these other priorities, with worrisome consequences and potentially great future costs to poor and non-poor Americans alike.


Please note that we at The Dispatch hold ourselves, our work, and our commenters to a higher standard than other places on the internet. We welcome comments that foster genuine debate or discussion—including comments critical of us or our work—but responses that include ad hominem attacks on fellow Dispatch members or are intended to stoke fear and anger may be moderated.
With your membership, you only have the ability to comment on The Morning Dispatch articles. Consider upgrading to join the conversation everywhere.