
The New York Times last month published an analysis of Medicare spending trends and concluded that, contrary to the program’s budget busting reputation, annual cost growth has been moderate over the past decade or so. The implication is that the scramble to find more Medicare savings to narrow current and projected federal deficits should be reevaluated, given that previous predictions of runaway costs were off the mark. It’s a comforting picture, especially to those who would prefer to expand Medicare. But does the Times provide the full story?
Medicare is a vast and complex program that, at any given moment, has pressures pushing costs both up and down. Analysts need to look at the full picture to get a balanced view of what is underway.
Even if per person cost escalation has moderated (which it has), many previous years of very high-cost growth already increased the program’s total outlays to a very high level, and there is no real prospect of a reversal. Moreover, the reasons for the current slowdown may not be sustainable: For example, payments per service under current law are not expected to keep up with inflation and therefore may not be sufficient to ensure full access to care for the program’s beneficiaries. With aging baby boomers pushing enrollment up from 66 million today to 83 million by 2040, aggregate costs will grow very rapidly over the coming three decades under almost all realistic scenarios.
In other words, much as many elected officials might wish otherwise, the problem of high-cost entitlement programs outpacing government revenue remains central to the growing risk of a fiscal crisis.
Parsing the data.
The Times piece charts real per capita spending since Medicare began paying for services in the 1960s, with a focus on what has occurred this century. It suggests a slowdown in real spending per capita since 2011 has already provided substantial relief to the federal budget.
The authors calculate that if spending had continued to escalate after 2011 at the same rate as it did previously (it appears the reference period runs from 2000 to 2011), then aggregate Medicare expenditures from 2011 to 2023 would have been $3.9 trillion higher than what was actually spent. The cited figures imply that the spending trend against which actual spending should be compared—the yellow line in the graph below—is 4.4 percent annual growth. If that was indeed avoided after 2011, then the budget did benefit substantially from a slowdown in Medicare spending.
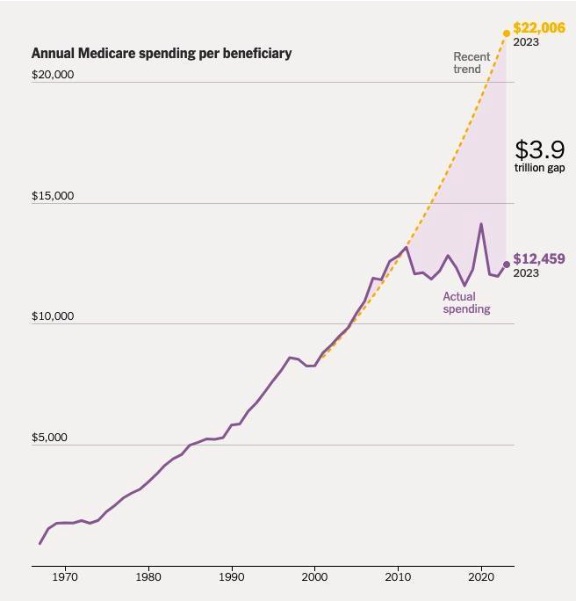
But while a slowdown happened, it was less dramatic than the Times implies. Though fully replicating the figures used in the reporting is difficult without additional information, it’s possible to make a similar assessment based on publicly available data. That reveals a somewhat different picture.
As the Congressional Budget Office (CBO) has noted, when making a calculation of per capita trends in the period after the turn of the century, the addition of drug coverage to Medicare expenditures starting in 2006—the largest benefit expansion since enactment in 1965—distorts calculations of average annual growth rates.
According to data from official national health expenditure (NHE) tables, nominal per capita spending growth in Medicare was 16.5 percent in 2006, when the drug benefit was first implemented. (Congress passed the legislation in 2003.) With economy-wide inflation then running at 2.7 percent, the jump in real per capita spending that year was 13.8 percent. In 2005, it was 3.8 percent; in 2007, 2.3 percent.
Based on this same NHE data, the average annual growth rate from 1996 to 2011 (not counting the one-time effects of the Medicare expansion in 2006), was about 2.5 percent, far below the 4.4 percent assumption used in the Times.
Using this lower estimate of real per capita growth drastically affects the main conclusion. If real Medicare per capita spending had grown by 2.5 percent over the period 2011 to 2023, the added spending relative to what actually occurred would have been about $2.3 trillion, not $3.9 trillion.
The trend started before 2000.
While the spending slowdown in Medicare was less pronounced after 2011 than the Times suggests, it did occur. However, the change began long before 2010, and even before 2000.
According to NHE data, between 1987 and 1996, the average annual real per capita growth rate within Medicare was 5.2 percent. From 1996 to 2005, the rate was cut roughly in half, to 2.7 percent. From 2006 to 2022, it dropped again, to 0.7 percent.
Why did the downward trend begin nearly three decades ago and not in 2011?
While there are likely many explanations, the most obvious is the steady implementation of congressionally-mandated payment reforms (and cuts). When Medicare began offering insurance coverage, it paid for services based on reported costs from providers. Hospitals and physicians would file claims documenting what they spent when caring for program beneficiaries, and Medicare would send them checks with few questions asked. This fueled hyperinflation: From 1970 to 1980, Medicare spending per person grew at an average annual rate of 13.4 percent.
After some uncertainty about possible remedies, Congress settled on a strategy in the 1980s. Instead of paying providers based on their self-reported costs, Medicare would pay for services using formulas designed to provide fair reimbursement for the average patient, and the payment amounts would be set in advance of any care being offered.
The switch started with the prospective payment system (PPS) for inpatient hospital care in 1983, and then was applied using separate provider-specific constructs to physician services (1992), skilled nursing facilities (1998), home health (2000), hospital outpatient care (2000), and much else.
In addition to these broad reforms, Congress regularly imposed cuts in the inflation factors used to increase payment rates each year. These provisions were included in the many broad deficit-cutting bills that were approved during this era.
By the mid-1990s, the cumulative effect of these cuts began to pinch as there were fewer and fewer revenue-enhancing options to offset the strict controls of the regulated payment systems.
Additional factors.
While the slowdown in per capita spending growth began well before 2011, it did intensify over the past decade.
There are likely several reasons for the improvement, some of which were mentioned in the Times’ assessment while others were not:
- Deep provider cuts. The Affordable Care Act, along with 2015 legislation that reformed Medicare’s physician fee schedule, severely restrained provider payments over the past decade. In the ACA, the annual inflation adjustment for hospitals and other institutional providers was cut on a permanent basis by a “productivity adjustment” of approximately 1.0 percentage point every year, which is an approximation of the improvement in productivity observed in the national economy every year. But productivity improvement in the health sector is usually much less, and the actuaries assume it will average 0.4 percent annually in the future. In a separate law, Congress tightened the screws further by limiting the annual fee increases for physician services over several years to rates that are also well below general inflation.
These cuts have had a sizable cumulative effect. The savings are now so substantial that Medicare actuaries have been warning for years that they are unsustainable. In a memo released alongside the Trustees’ report each year, actuaries document that the divergence between Medicare and commercial payments for hospital and physician services will grow rapidly with the annual implementation of new cuts. By 2040, Medicare’s payments for physician services and hospital care are expected to be just 40 percent and 55 to 60 percent, respectively, of the average amounts paid by commercial insurers.
The strain is also leading to a political response. Pressure is now building to bump up reimbursements for care, which would have the effect of increasing real per capita cost growth.
- Enrollment shifts. The baby boom generation began retiring over the past decade. In 2008, 43 percent of the 65 to 74 population was enrolled in Medicare. By 2021, it had grown to 50 percent. The surge in younger enrollees, with lower than average costs, also may be affecting per capita trends.
- Better adherence to effective therapies. As noted, Medicare began covering outpatient prescription drugs in 2006, and the CBO concluded some years after the law was implemented that it was having a positive effect on health outcomes by improving adherence to effective therapies. Moreover, these improvements in health status were lowering the use of non-drug services, with every 1.0 percent increase in drug use reducing other medical care costs by about 0.2 percent. This reduction in future spending growth is noticeable, but it is unlikely to fully offset the effects of building a legislative expansion of Medicare (as occurred with drugs in 2006) into the baseline spending projections.
- Medicare Advantage spillover effects. Much has been made about the excessive payments made to Medicare Advantage (MA) plans—the private insurance options offered to program beneficiaries in lieu of the traditional government-administered benefit—based on a flawed system of risk adjustment. There has been less focus on the consistent findings of researchers that higher market penetration by MA produces spillover savings in the government option. A recent study found that every 10 percentage point increase in MA penetration was associated with sizable reductions in post-acute care for patients with congestive heart failure when the markets also included medium to high use of accountable care organizations, which are provider-led managed care arrangements operating under the government-administered umbrella.
The bigger picture.
While the Times provided less than a full view of per capita cost trends, it was not wrong about an improvement. Real per capita spending in Medicare has not been rising as fast since 1995 as it did during the program’s first three decades.
But the Times misses the broader fiscal context. Even with moderate year-to-year rises in spending (which may not last), the federal government’s budgetary outlook has been rapidly deteriorating. Medicare is one reason for the trend. Program spending has grown faster than the revenue and premiums dedicated to Medicare for many years, and the gap will widen as the population ages.
According to Medicare trustees, total program spending in 1980 was 1.4 percent of GDP, with revenue and premiums coming into the program equal to 0.9 percent of GDP, which covered about two-thirds of the spending. By 2010, program expenditures were up to 3.5 percent of GDP (in part because of the new drug benefit) but program receipts had only risen to 1.9 percent of GDP, which only covered a little over half of the total cost. This gap between spending and receipts has continued to widen, and it will become especially problematic as the population ages. There were 28 million Medicare beneficiaries in 1980. By 2040, there will be more than 83 million.
It all adds up to a major fiscal challenge. CBO’s current long-term forecast shows the federal debt rising to above 180 percent of GDP in three decades, with the growing costs of Social Security and Medicare as principal reasons for the added borrowing.
Policymakers should take some comfort from the fact that, as the Times shows, it is possible to restrain Medicare spending with strong controls and incentives for more efficient care delivery. But one should not risk becoming complacent. With the government borrowing at levels that have no precedent in the nation’s peacetime history, it is inconceivable that a correction will occur without further changes to Medicare.


Please note that we at The Dispatch hold ourselves, our work, and our commenters to a higher standard than other places on the internet. We welcome comments that foster genuine debate or discussion—including comments critical of us or our work—but responses that include ad hominem attacks on fellow Dispatch members or are intended to stoke fear and anger may be moderated.
With your membership, you only have the ability to comment on The Morning Dispatch articles. Consider upgrading to join the conversation everywhere.