
“Did you adjust for inflation?” An occupational inconvenience of doing economic research is that you are routinely asked by disbelieving non-researchers whether your numbers have taken into account the rising cost of living. The answer to that question is nearly always, “Yes.” The debates among researchers are about how to adjust earnings and income for inflation, and specifically which price index to use.
These debates have significant implications for policy and our understanding of economic challenges. Last week, the Census Bureau announced it will use a new price index to adjust past earnings and income estimates that will be more accurate and, as such, a better tool for policymakers. It’s bigger news than it might seem.
If nominal income rises by 5 percent but prices rise by 4 percent, then “real” income (adjusted for inflation) rises only by approximately 1 percent. But knowing how much prices have risen requires a well-measured price index. Put simply, a price index looks at a changing set of goods and services that is intended to provide a constant level of satisfaction or well-being over time. This set of goods and services reflects items purchased by the typical American consumer.
Researchers have several options to choose from when looking for a price index, which go by different clumsy acronyms. Every month, the Bureau of Labor Statistics (in the Labor Department) publishes the Consumer Price Index (CPI-U) and the Bureau of Economic Analysis (in the Commerce Department) publishes the Personal Consumption Expenditures (PCE) price index. These are the inflation measures that policymakers, consumers, businesses, and investors monitor carefully.
Researchers want the best measures possible when they look at long-term trends in prices or real income. The Bureau of Labor Statistics has produced spinoff CPI series that extend improvements back as far as it can. And so when the Census Bureau publishes new earnings and income estimates every year, it includes historical figures that are adjusted for inflation using the current spinoff series, the R-CPI-U-RS (we warned you …).
One challenge in measuring price changes is that consumers respond to them by altering what they purchase. If the price of red delicious apples rises, some will switch to gala apples. Consumers will be worse off for the price increase, but not as worse off were their only options to pay more for red delicious apples or buy no apples. So a price index should factor in “substitution.” The CPI-U began to account for such “lower-level” substitution in 1999, and the R-CPI-U-RS extends this improvement back to December 1978 (after that, it reverts back to the CPI-U for earlier years).
However, neither of these indexes accounts for “upper-level substitution”—when consumers switch from apples to oranges in response to apples getting pricier. Accounting for upper-level substitution involves a methodology called “chaining.” BLS has created yet another index—the “chained CPI-U,” or C-CPI-U—that accounts for both kinds of substitution.
Which brings us to the Census Bureau’s recent announcement. Moving forward the Census Bureau will use the new index to adjust past earnings and income estimates from 2000 onward. (It will use its current methods to measure inflation before 2000.) This decision will make the Census Bureau’s earnings and income figures more accurate moving forward and will improve estimates of the change in these figures over time. Just as important, the Census Bureau’s stamp of approval will cause researchers to take their cue from the agency and adopt the new inflation series. As it happens, the new series will show stronger income growth over long periods of time, which ought to change how policymakers, researchers, and journalists think about our economic challenges. But the relevant point to celebrate is that our economic data will be more accurate, improving the ability of policy to improve people’s lives.
The Census Bureau could improve historical income estimates prior to 2000 as well, if future research allows the Bureau of Labor Statistics to extend the C-CPI-U further back in time. In the meantime, we can get a good sense of how that would affect historical income trends by applying the PCE price index before 2000 (and applying the C-CPI-U since 2000). While the PCE tracks a somewhat different set of items than the C-CPI-U and weights them differently, both price indices account for upper-level substitution bias and have tracked one another very closely historically. Applying the PCE price index therefore provides a better sense of changes in real income prior to 2000 than relying on the R-CPI-U-RS.
Figure 1 illustrates the impact of the inflation measure chosen on median household income trends since 1967. The blue line (old method) adjusts for inflation using the R-CPI-U-RS; the red line (new method) uses the superior C-CPI-U since 2000 while continuing to use the flawed R-CPI-U-RS before 2000; and the green lined (alternative method) applies a superior price index for the entire period, the C-CPI-U since 2000 and the PCE price index before 2000.
Figure 1. Median household income using various inflation measures, United States, 1967-2021
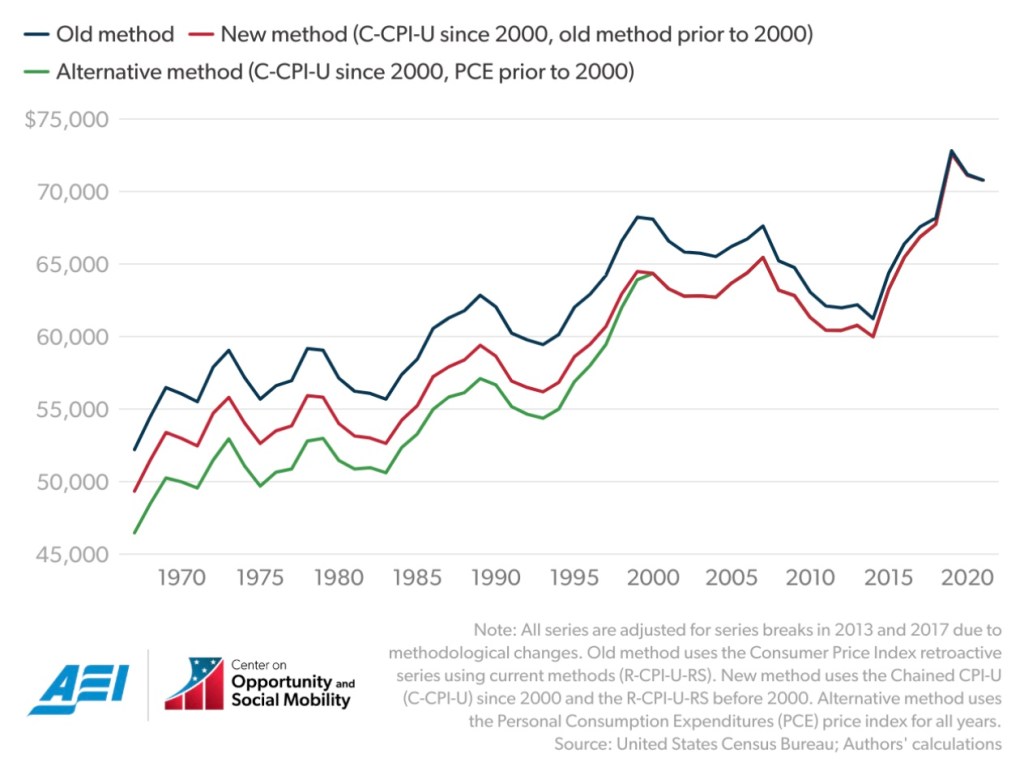
Since all three series are expressed in 2021 dollars, median income is equal to the same $70,784 value in 2021. But in previous years, real median income is lower under the new and alternative methods. That’s because inflation is lower under these methods, and so previous years’ nominal income values require less upward adjustment to convert them into 2021 dollars. Under the old method, median income increased by 36 percent between 1967 and 2021. Under the new method (which applies a more accurate measure of inflation since 2000 only), median income increased by 43 percent over the same 54 year period. Under the alternative method (which applies a more accurate measure of inflation all the way back to 1967), median income increased by 52 percent.
Using a more accurate inflation measure reveals that real incomes grew almost 50 percent faster over the past half century than previously reported. Measuring inflation more accurately shows much smaller effects over the short run, as illustrated by the fact that the blue, red and green lines are practically indistinguishable in Figure 1 for the most recent few years. It takes time for the small annual differences in price growth to compound into marked differences in long-term income growth.
This point contradicts any insinuation that the Census Bureau implemented this change for political reasons. Using a more accurate inflation measure will lead the Census Bureau to report that annual median income growth was $115 higher in 2022 than if it had used its old method. When considering that inflation over the year cost the median household more than $5,000, this is a small difference.
It’s also worth pointing out that the Census Bureau followed a well-established, multiyear process to inform its decision over whether to change its inflation measure. It involved publishing the potential change and its implications for income estimates in three consecutive years of the Census Bureau’s official income and poverty reports, publishing a 2022 working paper laying out the motivations for and implications of using a new inflation measure, and soliciting comments from scientific bodies and experts as well as the public.
The Census Bureau’s decision to begin using a more accurate inflation measure was not just apolitical, it was also the correct one. It will reveal that living standards in the United States have improved substantially more than is often claimed. Better data leading to happier facts—that’s good news all around.


Please note that we at The Dispatch hold ourselves, our work, and our commenters to a higher standard than other places on the internet. We welcome comments that foster genuine debate or discussion—including comments critical of us or our work—but responses that include ad hominem attacks on fellow Dispatch members or are intended to stoke fear and anger may be moderated.